– Rruchi Shrimalli
Are you fascinated by the performance of sponsored advertising on Meta platforms – Facebook and Instagram? Do you ever wonder how other marketers do it?
Let’s check out some of the most popular metrics and usage benchmarks that you’ll need to create a successful Facebook or Instagram ad campaign in 2023.
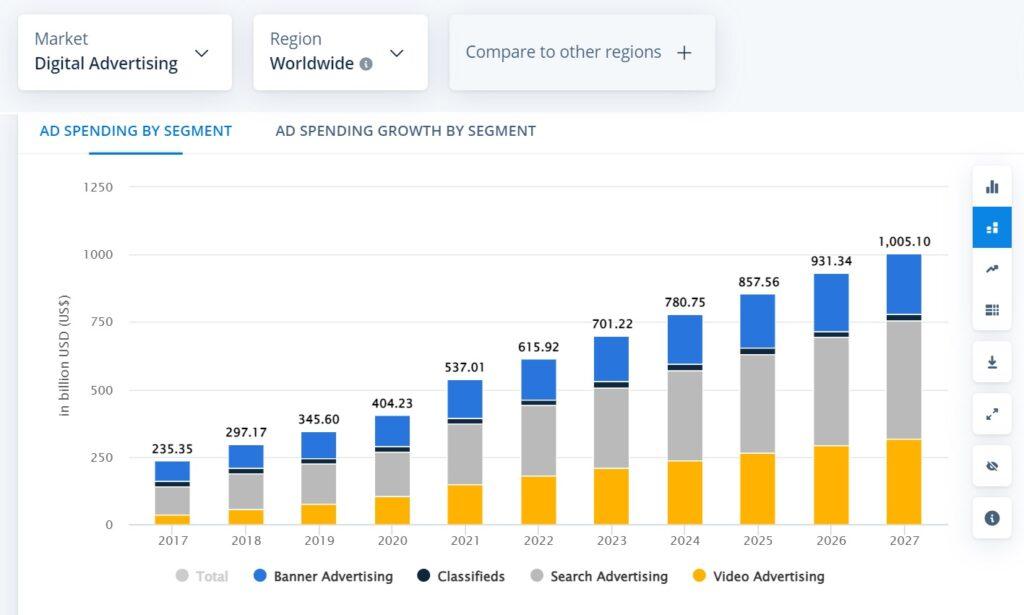
Spending on social media ads is on the rise
A lot of fresh money is flowing into social media advertising.
According to Statista, the spending on social media advertising was project to reach USD 226 billion in 2022 with the US being the most aggressive one in the ad spending segment. The annual growth rate of social media ad spending is project to grow at an annual growth rate of 11.24% until 2027.
Many firms have been compelled to minimize their reliance on physical stores to sell their products as a result of the pandemic. This has resulted in a significant increase in brand direct-to-consumer spending.
According to Zenith, “much of this is new money to the ad market, [comes] from tiny firms that have had to migrate quickly to eCommerce to survive lockdowns, and from budgets that brands would have traditionally committed to retailers to secure physical shelf-space.”
And who controls the majority of social ad spending?
You guessed it—Facebook and Instagram (both being part of the Meta-verse now!)
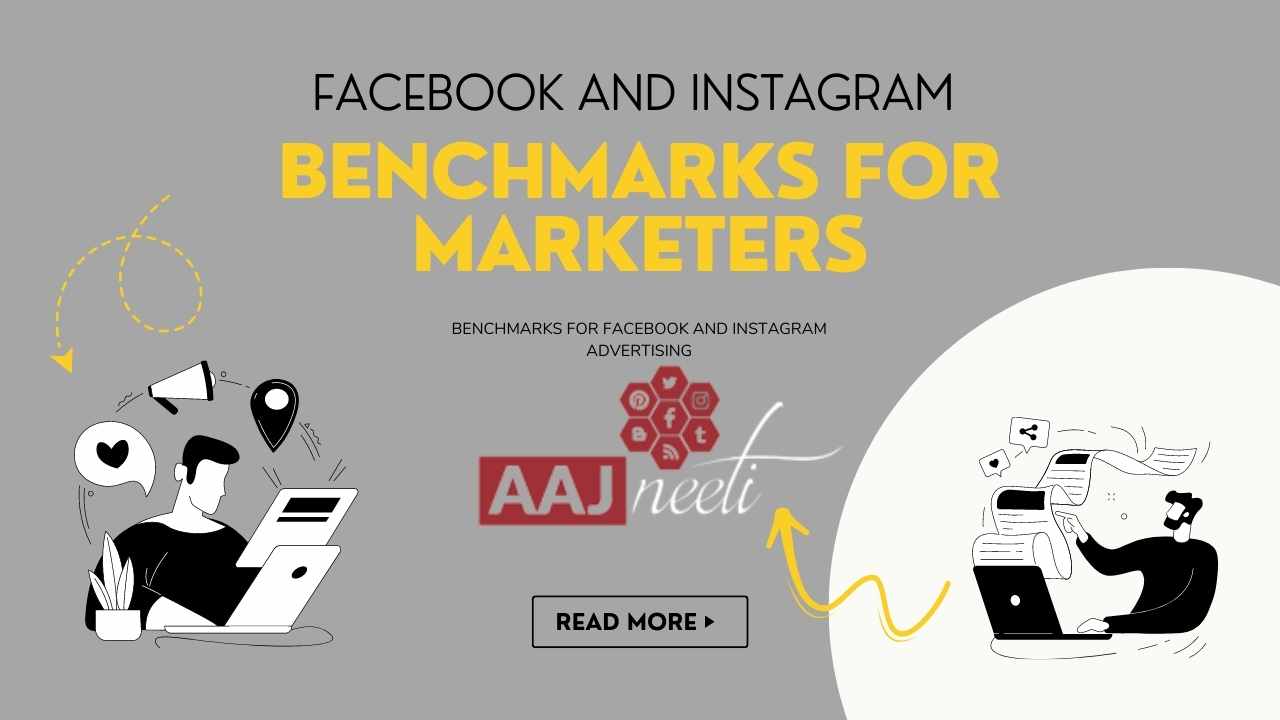
Benchmarks for Facebook and Instagram Advertising
According to the latest available report on social media benchmarks by Emplifi, the median social media ad spend has increased year-on-year (YOY), which is expected to rise in the Q4 or the holiday season. The retail industry led the ad spending in 2022, especially the brands from North America where ad spending rose by as much as 16% in an year.
One of the interesting revelation Emplifi made is that social media does not end with Meta. TikTok and Twitter also need to be a part of a robust social media ad strategy in 2023 and beyond. While Instagram was able to outperform TikTok in video views by Q3, the median reach engagement rate of TikTok is still higher. Similarly, the follower growth of TikTok was massive in 2022 – as much as 200%!
Response times to comments on Twitter was less than half of those on Facebook and Instagram. However, industries tend to have a direct message response rate of 70-80% on Facebook – much higher than Twitter (40%) or Instagram (30%). Perhaps, that’s the reason users question engage with brand posts more on Facebook and ask more questions for further clarifications.
The bad news is that the click-through rate (CTR) has fallen for brands across the world. CTR for retail and ecommerce industries were the biggest hit while beauty, bank, and accommodations saw some upward trends in 2022.
Meta Ad Benchmarks
You must know that Meta ads are sold in an auction environment. It means that the advertising cost is determined by supply and demand. You can control the Facebook ad costs by using several tools and settings. You can decide on how much you want to spend on a campaign or how much you want to spend per result.
Let us see how much Facebook ads are costing right now based on different benchmarks:
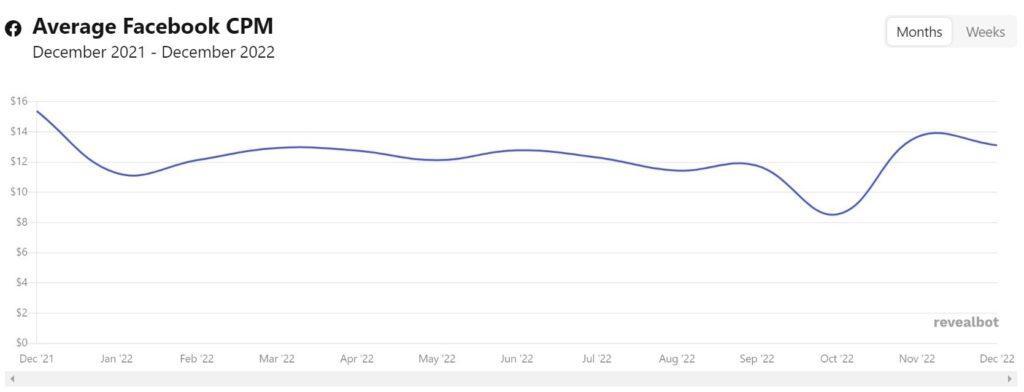
According to the Revealboat that displays real-time Facebook ad cost data, the average Cost per Thousand Impressions or CPM is down from $15.38 in December 2021 to $13.12 in December 2022. This cost is calculated based on the visibility of your ads.
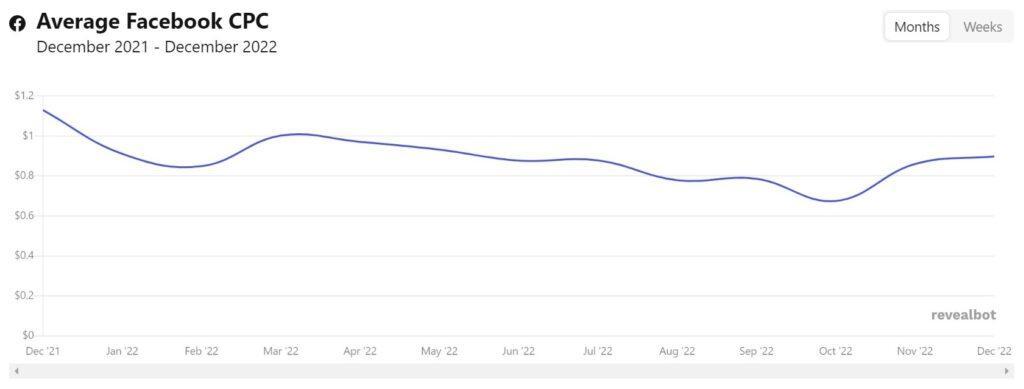
The average Cost Per Click or CPC for Facebook Ads is down from $1.08 in December 2021 to $0.898 in December 2022. This cost is calculated based on the number of clicks your ad gets.
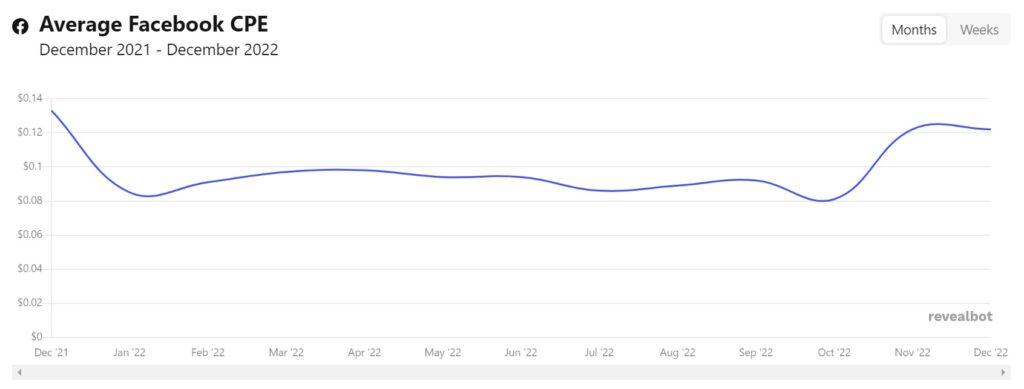
The average Cost Per Engagement or CPE for Facebook ads is down from $0.133 in December 2021 to $0.122 in December 2022. The cost is calculated based on the engagements on a Facebook post in the form of likes and reactions, clicks on links and pages, media clicks, shares, and comments.
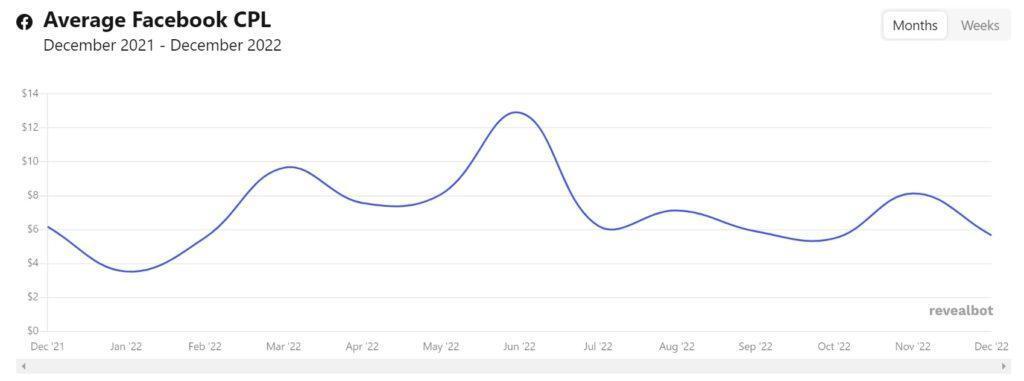
The average Cost Per Lead or CPL for Facebook ads is down from $6.17 in December 2021 to $5.66 in December 2022. Here, the cost is calculated based on clicks on ‘call to action’ in Facebook campaigns with the lead generation objective.
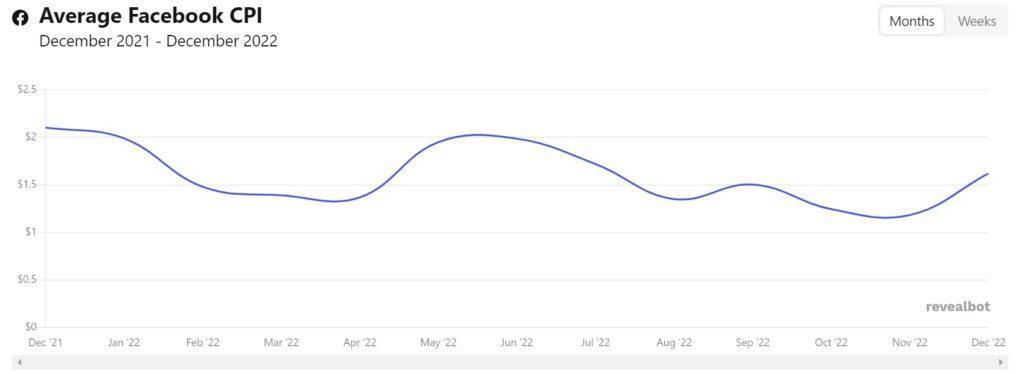
The average Cost Per Install or CPI for Facebook ads is down from $2.1 in December 2021 to $1.62 in December 2022. This cost is calculated when people install your mobile app through your Facebook ad campaigns.
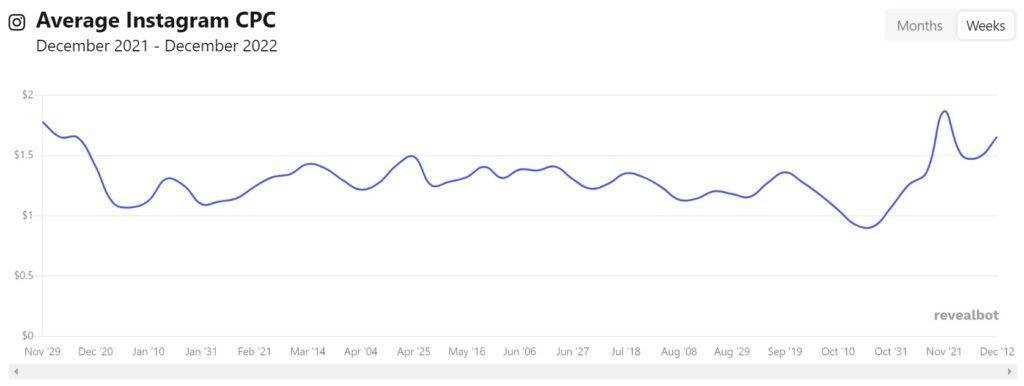
Instagram ad costs in 2o22 by Revealbot shows similar trends. The average Cost per Thousand Impressions or CPM for Instagram ads is slightly down from $13.98 in December 2021 to $12.07 in December 2022.
The average Cost Per Click or CPC for Instagram Ads is almost stable. It was $1.65 in December 2021 to $1.66 in December 2022.
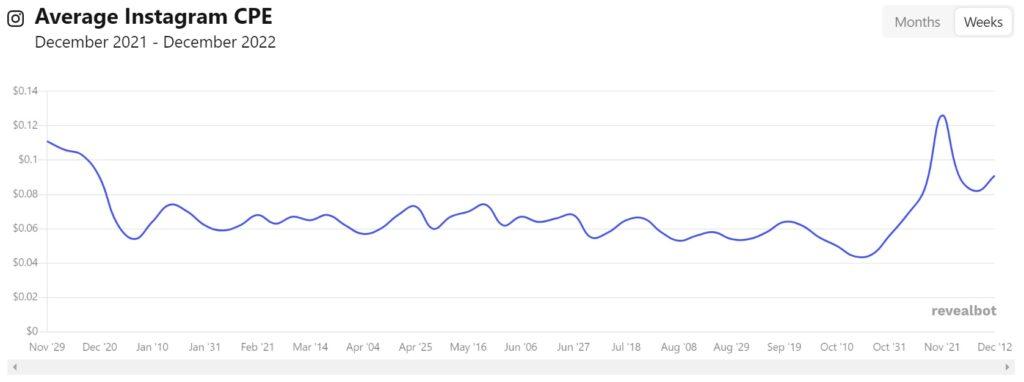
The average Cost Per Engagement or CPE for Instagram ads is down from $0.106 in December 2021 to $0.091 in December 2022.
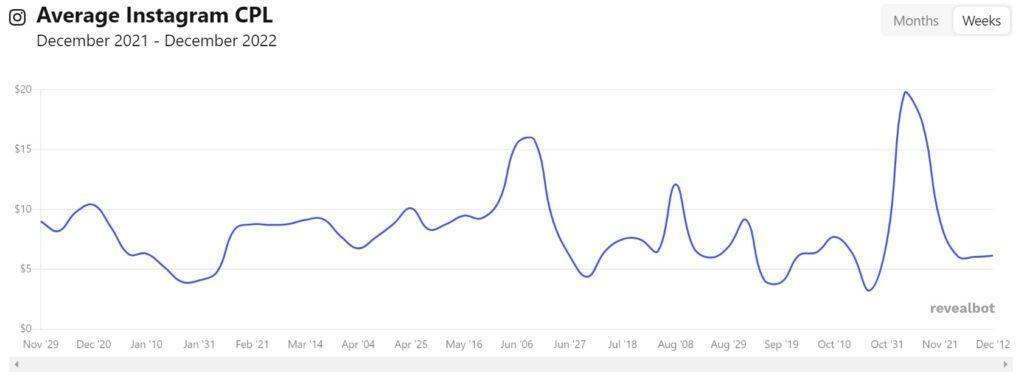
The average Cost Per Lead or CPL for Instagram ads has significantly come down from $8.19 in December 2021 to $6.15 in December 2022.
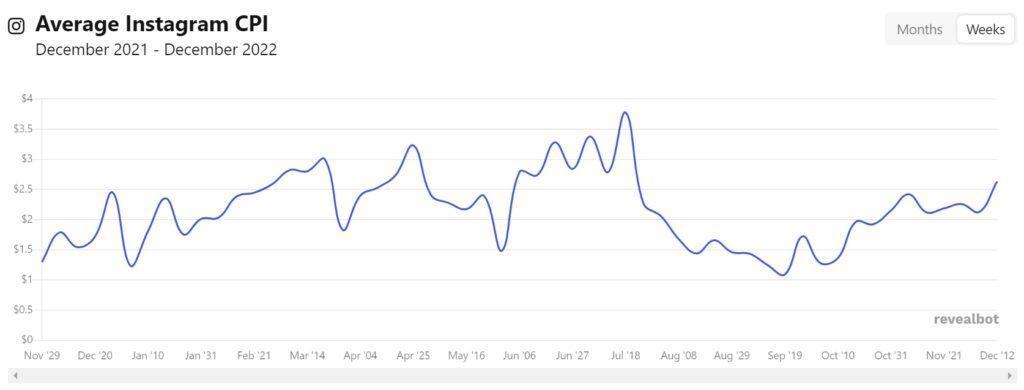
The average Cost Per Install or CPI for Instagram ads has almost doubled. It has gone up from $1.79 in December 2021 to $2.63 in December 2022.
Some other significant social media benchmarks digital marketers often use are:
- Click Through Rate (CTR): It is the percentage of users who click on your ad. Formula to calculate CTR is: (Number of Ad Clicks/Number of Ad Impressions) X 100. The average CTR for Facebook ads is 0.9% across all industries. On an Instagram ad, over 2% CTR is considered good while 0.88% CTR is considered acceptable for Instagram reels.
- Conversion Rate (CVR): This is an important benchmark to check the results Facebook ads are generating for a client. Formula to calculate CVR is: (Number of Ad Conversions/Number of Ad Clicks) X 100. The average CVR for Facebook ads is 9.21% across all industries.
- Cost Per Action Rate (CPA): Quite popular with the Education Industry, CPA is the price advertisers pay when users perform the targeted action after seeing the ad. The average CPA across all industries is $18.68.
Till now, CTR is considered as the best way to decide how good a content is (based on how many users click on the notification). But recently, Instagram notifications have moved to the Causal Inference and Machine Learning (ML) models to identify users who are more active on the platform and are more likely to engage with notifications.
Now that you’ve learned about the top digital marketing trends for 2022, it’s time to get started. Why don’t you take a look at some of our other articles?
Top 15 B2b lead generation companies in India in 2025
B2B Lead generation: what’s the best approach?
How to generate highly qualified b2b leads using Google Ads
How to generate effective b2b Leads Using Meta+ ads.
Thank You and Happy New Year from the AAJNeeti Family!